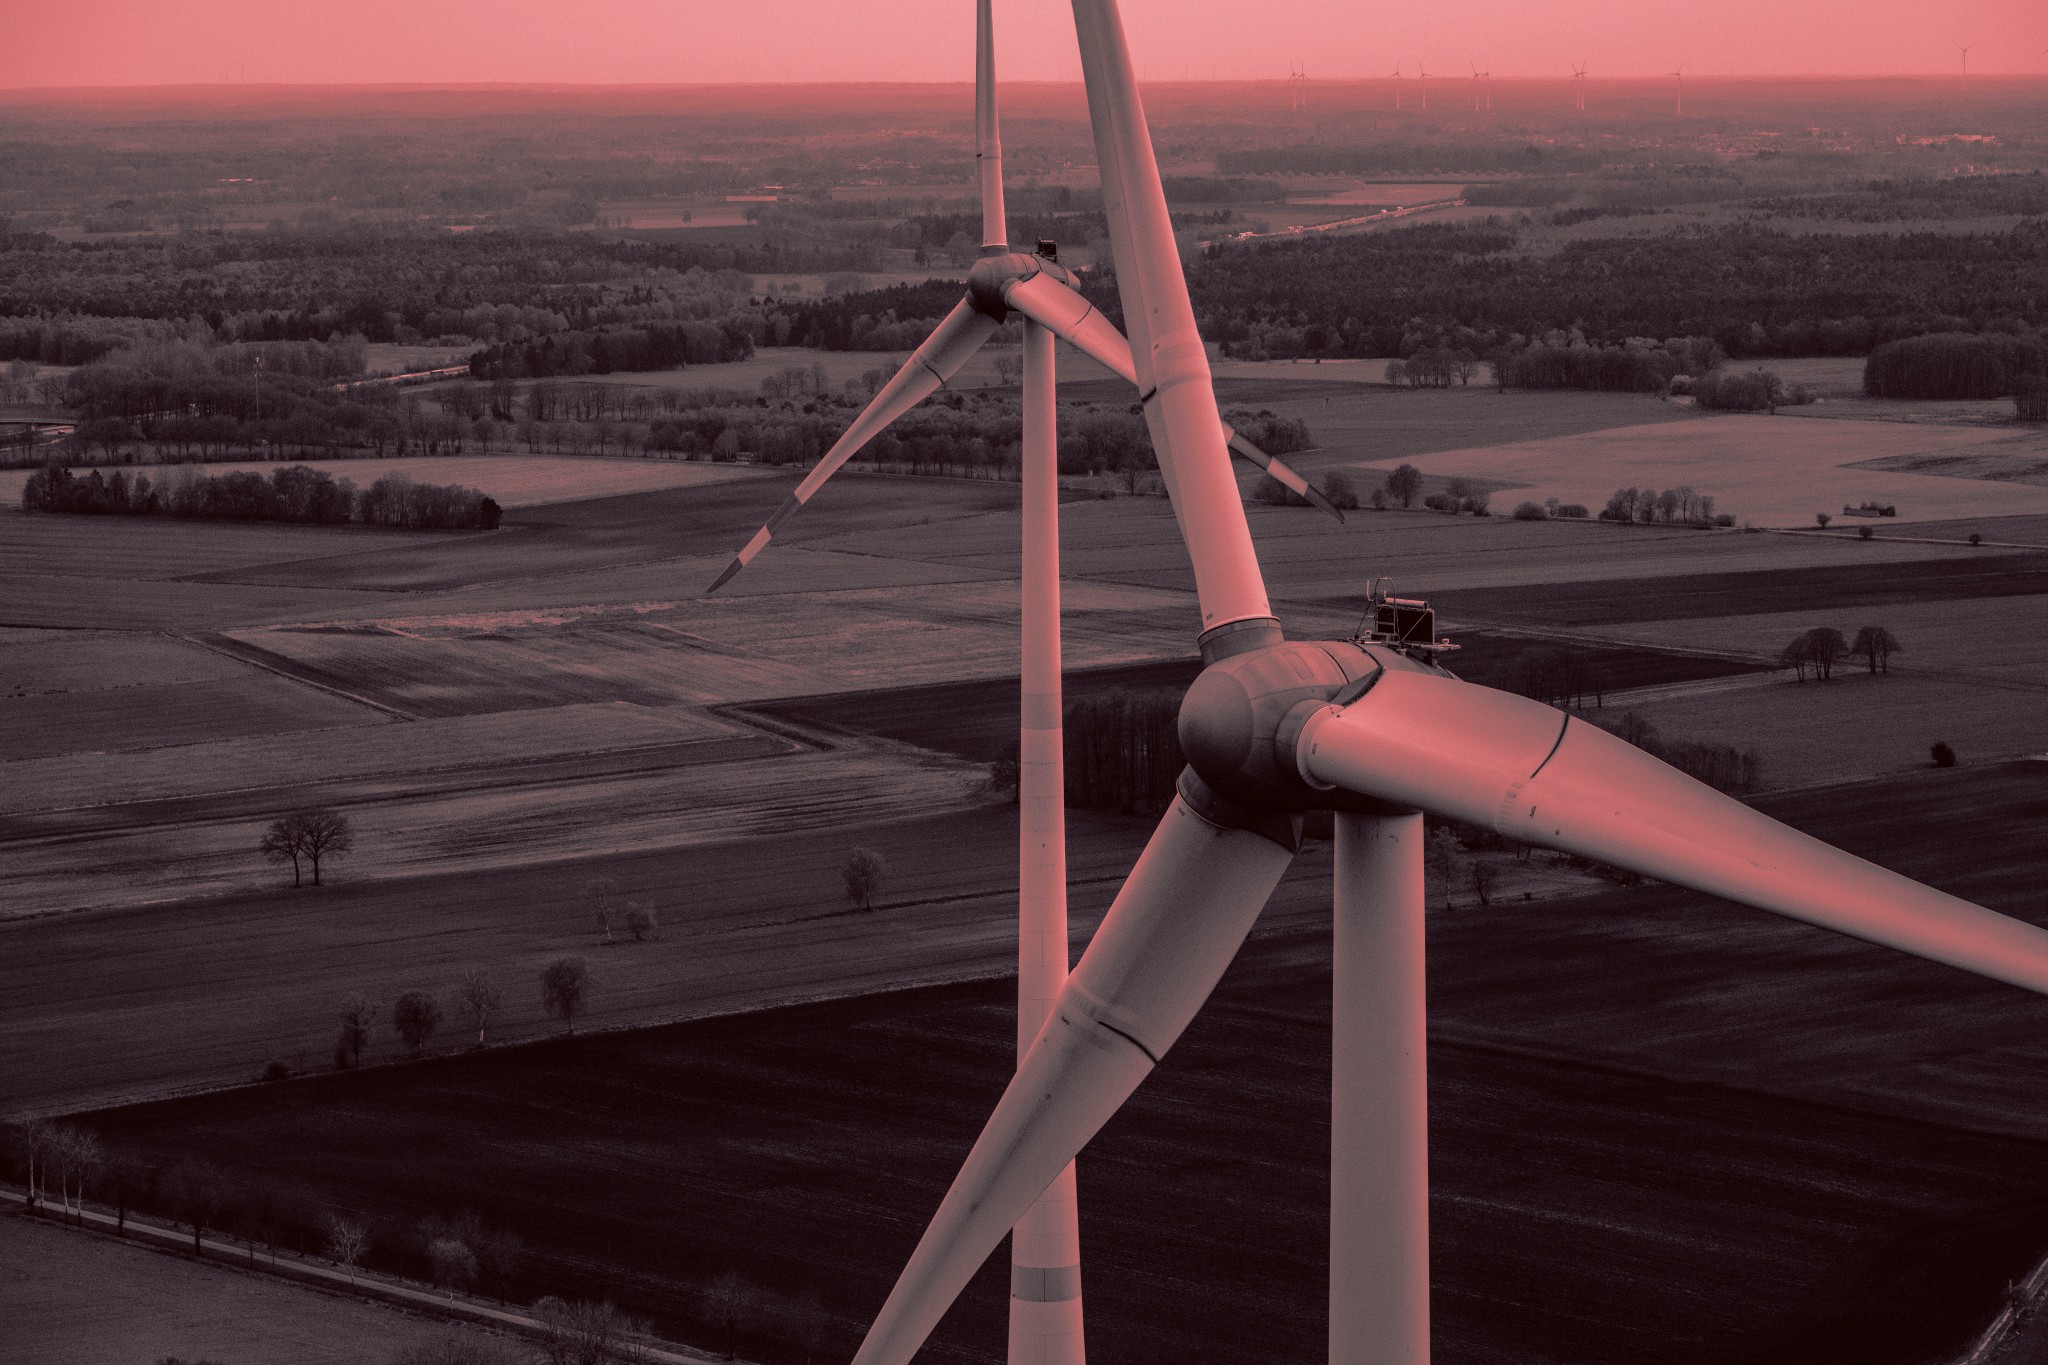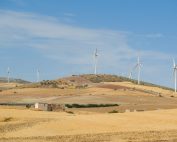
Global clean energy deployment scaled new heights in 2023, with annual additions of solar PV and wind growing 85% and 60% respectively. Capacity additions for these two technologies reached almost 540 GW, with China accounting for the majority of both. Clean energy deployment in 2023, however, remained too concentrated in advanced economies and China, with the rest of the world continuing to lag well behind. In 2023, China and advanced economies accounted for 90% of capacity additions for wind and solar PV, and more than 95% of global sales of electric cars.
Electric car sales grew around 35% in 2023, reaching 14 million vehicles or one-in-five sales globally. China again led the way, with one-in-three cars sold being electric, while in the European Union it was one-in-four.
By contrast, heat pump sales globally saw a marginal decline from the record levels of 2022, as squeezed consumers avoided spending on big ticket items and concerns around high gas prices eased somewhat. The slowdown of heat pump sales highlights the importance of supportive policies to help cash-strapped consumers and reduce the gap between electricity and gas prices.
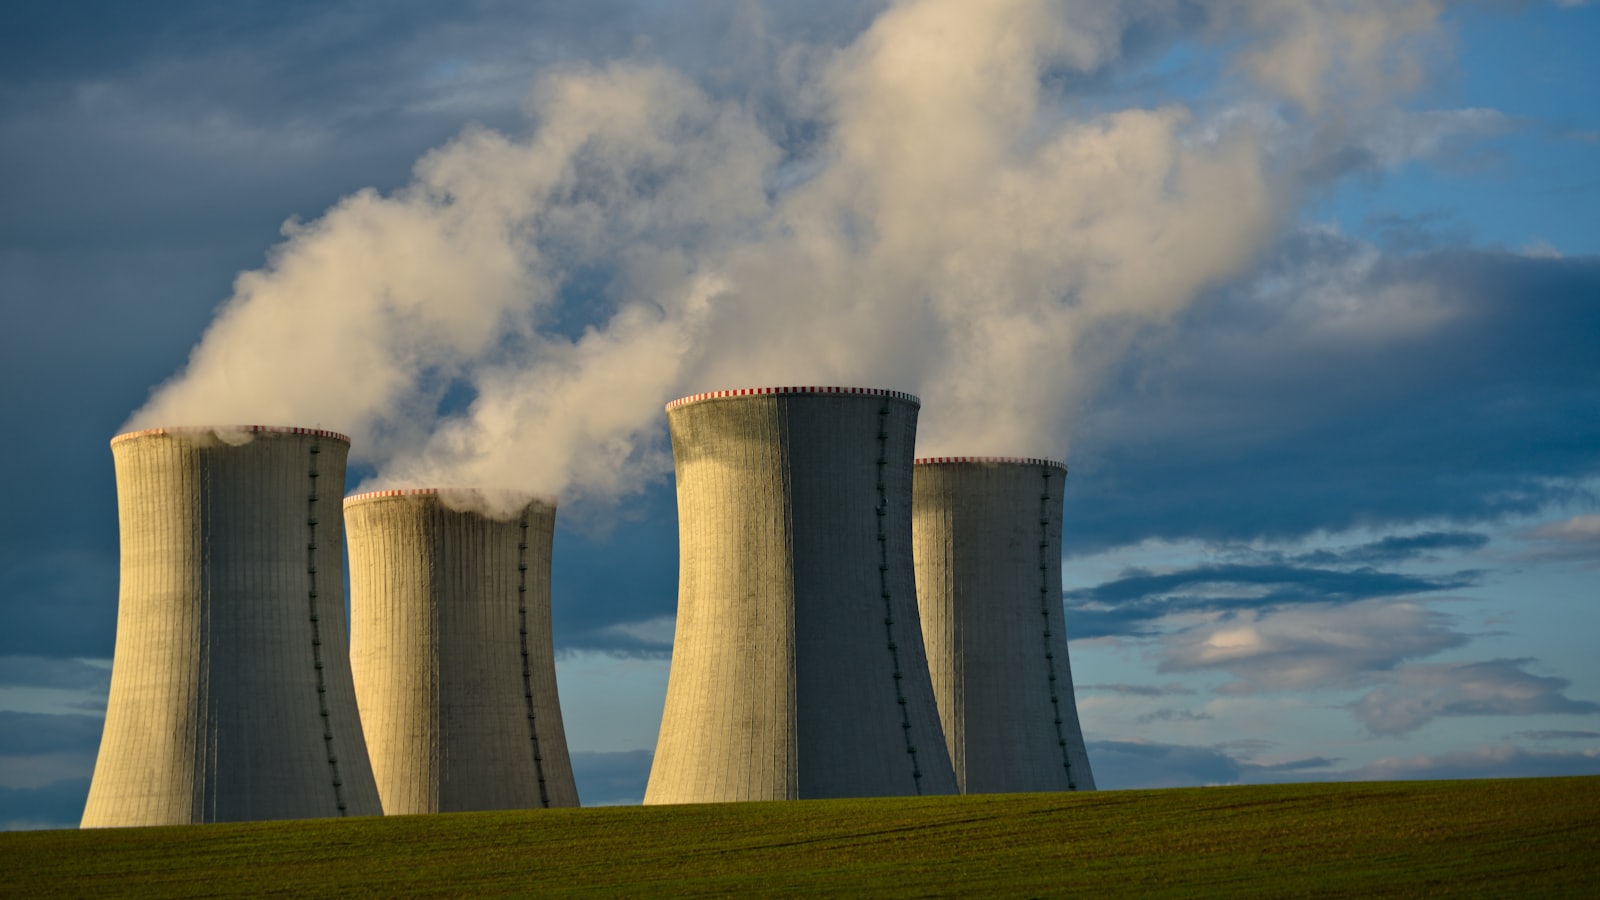
Nuclear capacity additions fell to 5.5 GW in 2023, although year-on-year variations in capacity additions are less meaningful for a technology with long project development and execution times. Construction of new nuclear reactors started on 5 projects in 2023. At the start of 2024, there were 58 reactors under construction worldwide – a total capacity of over 60 GW.
Hydrogen electrolyser capacity additions grew by 360% in 2023, but from a very low base. This increase was due largely to China, as the European Union ceded its leading position. The United States also increased the speed of deployment, but annual additions remained modest in absolute terms.
Energy efficiency is lagging behind, however. Our latest assessment shows an energy intensity improvement of around 1% in 2023, four times lower than the COP28 pledge to double the long-run rate of energy intensity improvement by 2030.
On the back of Covid-19 stimulus packages, there has been a significant acceleration in clean energy deployment since 2019. From 2019 to 2023, clean energy growth outpaced growth in fossil fuels by a ratio of two-to-one. The production of low-emissions electricity grew by around 1 800 TWh, despite the stagnation of hydro power and decline of nuclear power due to drought and forced outages of the nuclear fleet in the European Union. Fossil fuel-based electricity generation grew by slightly less than 850 TWh. In end uses, the consumption of clean energy grew around two times more than fossil fuels.
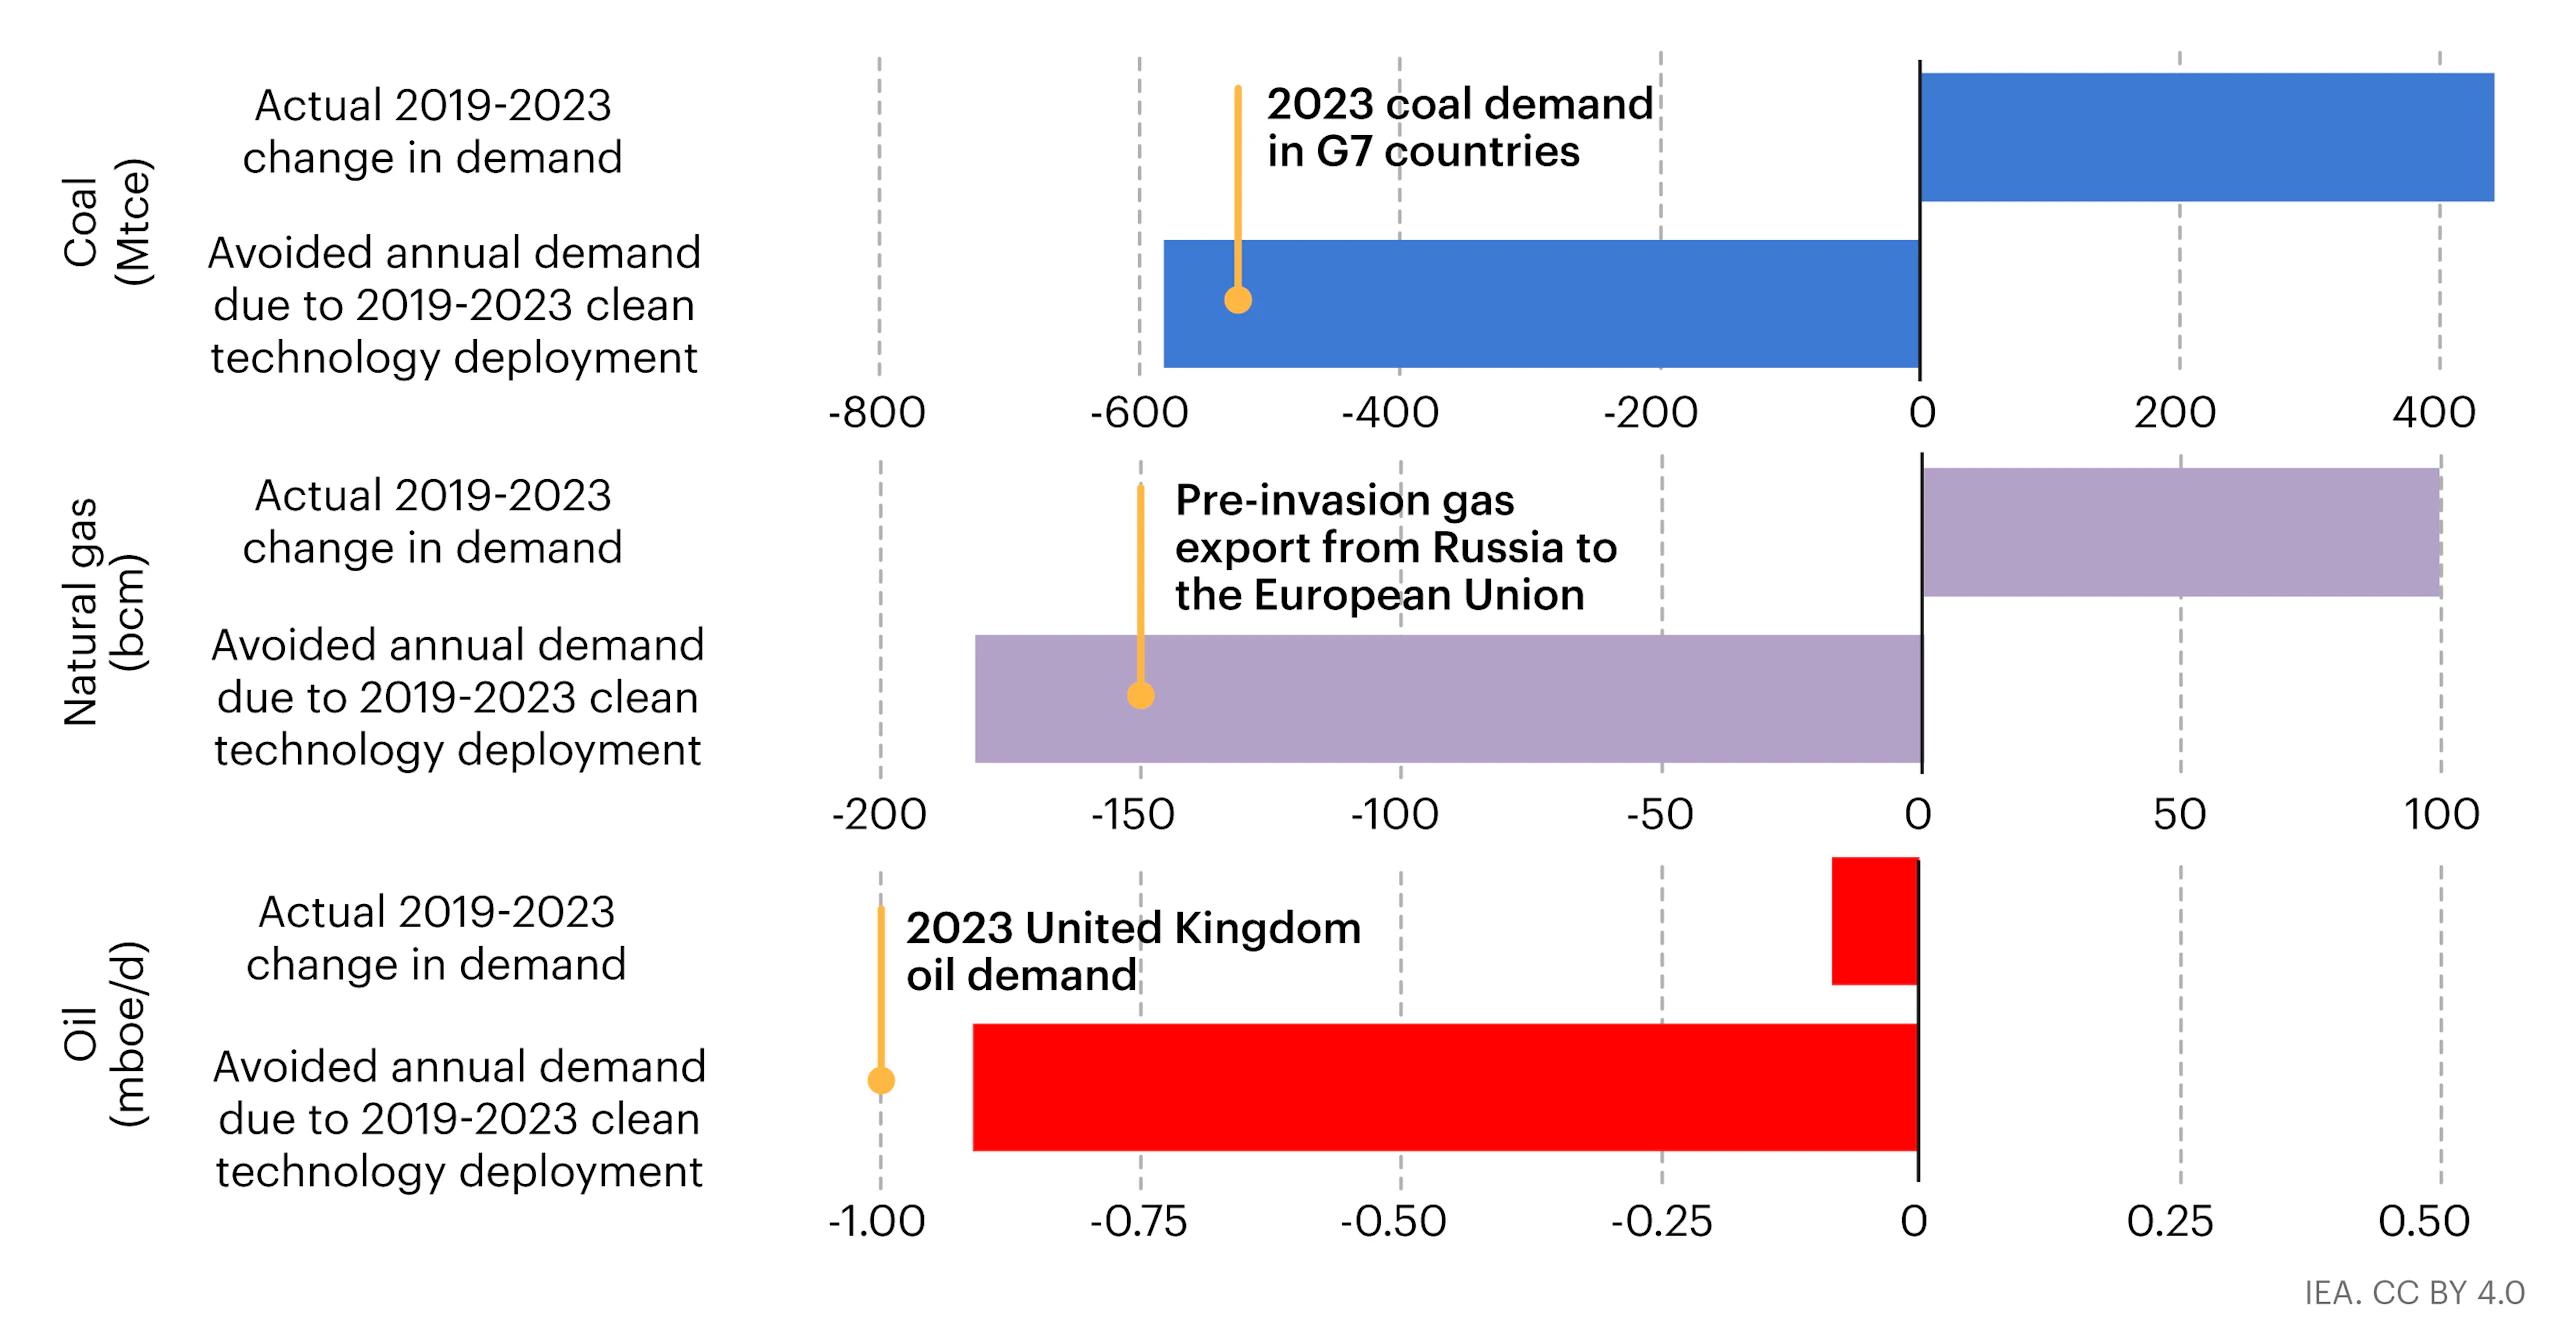
The deployment of five key clean energy technologies – solar PV, wind power, nuclear power, electric cars and heat pumps – from 2019 to 2023 avoids annual fossil fuel energy demand of around 25 EJ. This is equivalent to 5% of total global fossil fuel demand in all sectors in 2023, or almost the combined total energy demand of Japan and Korea from all sources last year.
The coal demand avoided is around 580 million tonnes of coal equivalent (Mtce) annually. This is 30% higher than the actual increase in global annual coal demand of around 440 Mtce from 2019 to 2023. The largest driver of avoided coal demand was deployment of solar PV and wind power in electricity sectors around the world, with the two technologies avoiding around 320 and 235 Mtce of annual coal demand respectively. This is equal to the annual coal demand for electricity generation of India and Indonesia combined.
Avoided demand for natural gas is around 180 bcm annually on an energy equivalent basis. This is nearly two times more than the actual increase in global annual natural gas demand of around 100 bcm from 2019 to 2023. The deployment of wind and solar PV provides the largest share of this avoided natural gas demand (155 bcm), although heat pump deployment also avoids around 15 bcm of annual demand and nuclear power also contributes. The avoided gas demand is more than the pre-invasion pipeline exports of natural gas from Russia to the European Union, which were around 150 bcm in 2021.
Avoided demand for oil amounts to almost 1 mb/d in energy equivalent terms. Without this, oil demand would have risen above the pre-pandemic level instead of hovering still slightly below it in 2023 on an energy equivalent basis. Electric cars provided the majority of avoided oil demand.
The deployment of solar PV, wind power, nuclear power, electric cars, and heat pumps from 2019 to 2023 avoids around 2.2 billion tonnes (Gt) of emissions annually. Without them, the increase in CO2 emissions globally over the same period would have been more than three times larger.
At the global level, the deployment of solar PV over the last five years avoids around 1.1 Gt of emissions annually, equivalent to the annual emissions of Japan’s entire energy sector. In some markets the impact is even more significant. In Australia and New Zealand, deployment of solar PV over the last five years avoids annually an amount of CO2 equivalent to almost 10% of the region’s total annual emissions from energy in 2023.
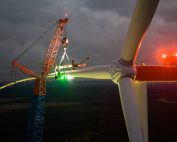
Avoided annual emissions from wind power amount to around 830 Mt of CO2; from nuclear 160 Mt CO2; from electric cars and heat pumps 60 Mt and 50 Mt CO2respectively. Although the reductions from electric cars and heat pumps are lower than the other technologies studied, they will increase in coming years as stock turnover raises the share of these technologies not just in annual new sales, but also in the much larger total stock of equipment in use.
Source: IEA